


Retirement Savings Guidelines
A global approach to helping workers reach their retirement goals
There’s an increasing need for employees globally to actively engage in the planning process for their retirement. Employers can play a key role by providing clear guidelines and engaging tools as part of their workplace investing programs. Fidelity has developed a globally-consistent set of retirement savings guidelines to help with this.
Based on four interconnected metrics the guidelines can help employees plan their journey and explore the impact of actions like saving more, retiring later or making lifestyle adjustments on their retirement goals. They can also help employers gain insights into the retirement readiness of their workforce.
First launched in the US, the guidelines have been extended to the UK, Ireland, Germany, Japan, China, Hong Kong and Canada. They are locally relevant and globally comparable.
What your savings need to cover in retirement is one of the first questions to consider when planning your retirement journey. In most regions, state/government pension support will provide an income base in retirement with the rest coming from personal savings.
The income replacement rate represents the difference between the total estimated income replacement required and the estimated state/government pension income replacement. This is the portion of retirement expenses that need to be funded from personal savings so you can maintain a similar level of spending to before you retired. The income replacement rate is expressed as a percentage of pre-retirement income. Part of this amount will come from current and former employer contributions.
Total income replacement rates differ across regions due to variations in the composition and level of personal consumption, taxation and other factors. The contribution from state/government support varies across countries due to differences in benefits from state/government pension schemes.
How much you need to retire can be a complex question to answer, particularly when you are years away from retirement. Savings milestones are a set of age-based savings factors which offer a simple way of estimating and monitoring progress towards retirement saving goals throughout your working life.
These age-based savings milestones are expressed as multiples of current income. Simply multiply your current income by age milestone to give you a savings target consistent with the savings balance needed to maintain your lifestyle in retirement.
How much you should save each year can be a key question in ensuring you are on track to meet your retirement goals. To have a high level of confidence in your ability to maintain your lifestyle in retirement, it’s best to save consistently throughout your career.
The savings rates are expressed as the percentage of income (before tax) that should be saved each year over the course of your working life. This figure may seem like a lot, but it includes all retirement savings across different accounts. Of course, you may not be able to do this every year, but there are always ways to catch up along the way and even small increases in the yearly savings rate can make a difference.
One of the most challenging questions you may face is how much to withdraw from savings once you have retired. Withdraw too much and you risk running out of money. Withdraw too little and you may not live the lifestyle you’d like in retirement.
Here’s an example of the possible sustainable withdrawal rate in action - John has $500,000 in retirement savings and plans to retire at age 65. Here’s how much he may want to withdraw each year.
Regional variance of retirement savings guidelines
While the guideline values may be different across regions, the underlying analytical framework that produces those values is globally consistent and produces guidelines that are locally relevant and globally comparable.
The values for these guidelines vary across regions due to differences in a variety of region-specific assumptions including observed saving/spending behavior, taxation, structure of state/government pension and health insurance schemes, mortality, assumed retirement age, wage growth, inflation, and capital market assumptions. Individually and in combination, these differences in assumptions/inputs result in cross-region differences in guideline values.
Global Whitepaper
Global retirement savings guidelines - engaging workers in financial planning
Things to keep in mind
Fidelity’s retirement savings guidelines refer to personal and workplace savings amounts only and exclude any state/government pension support. To generate the guidelines the framework makes simplifying assumptions about a variety of factors, including retirement age, retirement horizon, wage growth, investment returns, and asset allocation. The base case used to generate the guidelines assumes a hypothetical 25 year old with no current savings, and no private defined benefit (DB) pension income or other private lifetime income sources. All calculations and outputs are expressed in pre-tax terms. Along the way, and particularly as people get closer to retirement, it’s always a good idea to work with a financial advisor to create a retirement income plan.
- Global income replacement values reflect averages across the ranges of pre-retirement income (income immediately before retirement) as per the below regional ranges. Assumes no retirement savings balance before starting age. UK: Represents household income ranging from £30k - £100k annually. Represents quintiles 3-5 from the Office for National Statistics Income and taxation data from 'The Effects of Taxes and Benefits on Household Income, 2014/15'. Expenditure data from 'Family Spending 2014' compendium; local and state taxes not included; retirement age = 68 for base case. Ireland: Represents household income ranging from €30,000 - €150,000 annually. Representing quintiles 3-5 of income, expenditure, and taxation data from “Households where reference person is aged between 55 and 64 classified by Gross Household Income Quintiles 2015” report from the Central Statistics Office; local and state taxes not included; retirement age = 68 for base case. Germany: Represents household income ranging from €24k-€100k annually. Represents deciles 4-7 from the Sample Survey of Income and Expenditure (EVS) via the German Federal Statistical Office (Destatis); local and state taxes not included; retirement age = 67 for base case. Japan: Represents household income ranging from ¥5million – ¥9.5million annually. Represents deciles 3-9 from the Ministry of Internal Affairs and Communications, 2014 National Survey of Family Income and Expenditure Survey; local and state taxes not included; retirement age = 67 for base case. Personal savings of 36% includes 28% savings + 8% RSLP. China: Represent household income ranging from ¥10,000 and ¥50,000 per month. The analysis for China defines pre-retirement spending as pre-retirement household income less estimated taxes and savings (a mandatory 8% State Pension contribution to the personal account component is assumed); retirement age = 62 for base case. Hong Kong: Represents household income ranging from $HK25k-$HK150k per month. Represents deciles 6-9 from the Census and Statistics Department (Censtatd) publications backed by survey data. Income data from Quarterly Report on General Household Survey 2016 (latest data Q2 2016). Expenditure data from Household Expenditure Survey 2014-15; local and state taxes not included; retirement age = 65 for base case. US: Represents household income ranging from $50k to $300k annually in the Consumer Expenditure Survey (BLS), Statistics of Income Tax Stat, IRS tax brackets; local and state taxes not included; retirement age = 67 for base case. Canada: Represents household income ranging from $55k-$300k annually. Represents quintiles 3 - 5 from the Statistics Canada, 2016 Survey of Household Spending; local and state taxes not included; retirement age = 65 for base case. Fidelity Investments and Fidelity International are seperate trading names and through their combined networks provide global asset management and benefit administration solutions to customers. “Fidelity” refers to the combined network of brands that encompass Fidelity Investments and Fidelity International.
- Fidelity’s suggested savings milestones (expressed as multiples of current income at different ages) are based on our research, which estimates the savings balances at different ages that are consistent with the accumulation of savings necessary to maintain a pre-retirement lifestyle through retirement. In turn, these savings balances reflect an estimate of the region-specific % of preretirement annual income (assuming no pension income) through a planning age specific to each region that would be necessary to maintain that pre-retirement level of income in retirement. The region-specific income replacement targets were found to be generally consistent across a range of pre-retirement household incomes -- income at the point of retirement. The savings milestone suggestions may have limited applicability if your pre-retirement income is expected to fall outside that range. Individuals may need to save more or less than the suggest savings rate guideline depending on retirement age, desired retirement lifestyle, assets saved to date, and other factors. Fidelity developed the savings milestones through multiple market simulations based on historical market data. These simulations take into account the volatility that a variety of asset allocations might experience under different market conditions. Given the region-specific assumptions, including retirement age, planning age (life expectancy), wage growth, and income replacement targets, the Retirement Savings Guidelines were evaluated at the 90th percentile confidence level for the U.S. and China. Guideline values for all other regions were evaluated at the 80th percentile for the accumulation (working and saving) phase and the 90th percentile for the decumulation (retirement) phase. The average lifetime equity allocation of the hypothetical portfolio was assumed to be roughly 50%. Remember, past performance is no guarantee of future results. Performance returns for actual investments will generally be reduced by fees or expenses not reflected in these hypothetical calculations. Returns will also generally be reduced by taxes. Fidelity Investments and Fidelity International are seperate trading names and through their combined networks provide global asset management and benefit administration solutions to customers. “Fidelity” refers to the combined network of brands that encompass Fidelity Investments and Fidelity International.
- Fidelity’s suggested total pre-tax savings rates (expressed as a % of pre-tax current income) are based on our research, which indicates that most people would need to contribute at these rates from an assumed starting age of 25 through an assumed retirement age specific to each region (see general disclosure for regional details on retirement ages) to potentially support an income level equal to region-specific % of preretirement annual income (assuming no pension income) through a planning age specific to each region. The region-specific income replacement targets were found to be generally consistent across a range of pre-retirement household incomes -- income at the point of retirement. The savings rate suggestions may have limited applicability if your pre-retirement income is expected to fall outside that range. Individuals may need to save more or less than the suggest savings rate guideline depending on retirement age, desired retirement lifestyle, assets saved to date, and other factors. Fidelity developed the savings rate targets through multiple market simulations based on historical market data. These simulations take into account the volatility that a variety of asset allocations might experience under different market conditions. Given the region-specific assumptions, including retirement age, planning age (life expectancy), wage growth, and income replacement targets, the Retirement Savings Guidelines were evaluated at the 90th percentile confidence level for the U.S. and China. Guideline values for all other regions were evaluated at the 80th percentile for the accumulation (working and saving) phase and the 90th percentile for the decumulation (retirement) phase. The average lifetime equity allocation of the hypothetical portfolio was assumed to be roughly 50%. Fidelity Investments and Fidelity International are seperate trading names and through their combined networks provide global asset management and benefit administration solutions to customers. “Fidelity” refers to the combined network of brands that encompass Fidelity Investments and Fidelity International.
- This example is using US retirement guidelines and is for illustrative purposes only.
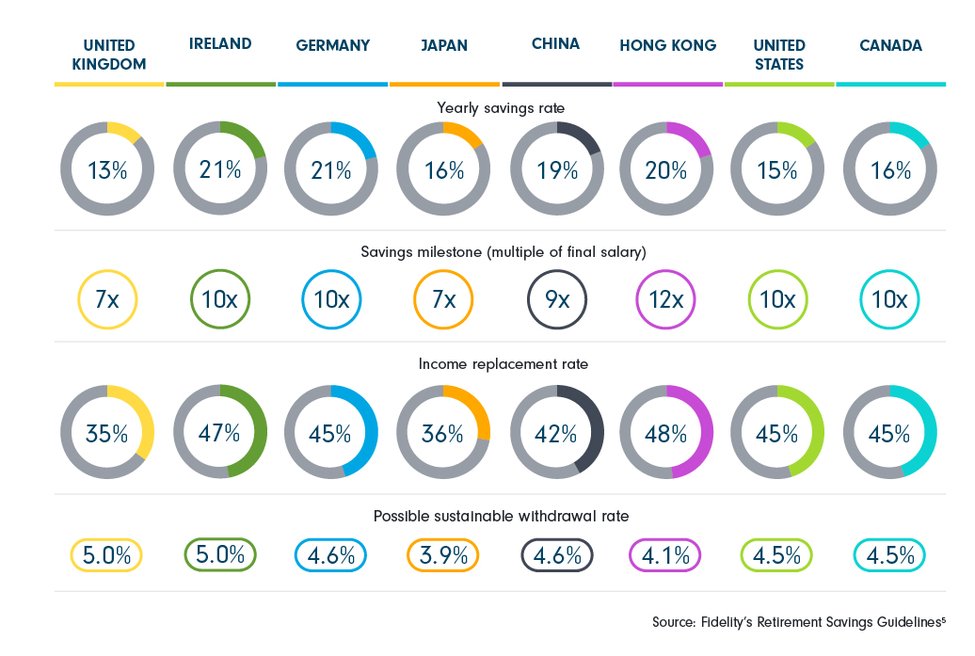
- Yearly savings rate: The suggested annual rate of (pre-tax) savings over a full working lifetime. Savings milestones: Age-based savings targets expressed as multiples of current income. Income replacement rate: The percentage of pre-retirement income that an individual/household should target to replace annually from their personal savings (including workplace savings) in retirement in order to maintain pre-retirement lifestyle. Possible sustainable withdrawal rate: The real (inflation-adjusted), annual withdrawal amount expressed as a percentage of the initial (at retirement) asset balance.
Hong Kong savings rate - 20% savings rate is net of an assumed 5% MPF contribution from both employer and employee pay. Japan’s income replacement rate - 28%, which excludes 8% income replacement from an assumed final lump sum salary payment of 2x annual pre-retirement salary. Canada’s income replacement rate assumes CPP enhancement, fully realised in base case (Current Age = 25). Fidelity Investments and Fidelity International are seperate trading names and through their combined networks provide global asset management and benefit administration solutions to customers. “Fidelity” refers to the combined network of brands that encompass Fidelity Investments and Fidelity International. - This example is using US retirement guidelines and is for illustrative purposes only.
Fidelity refers to one or both of Fidelity International and Fidelity Investments. Fidelity International and Fidelity Investments are separate companies that operate in different jurisdictions through their subsidiaries and affiliates. All trademarks are the property of their respective owners.